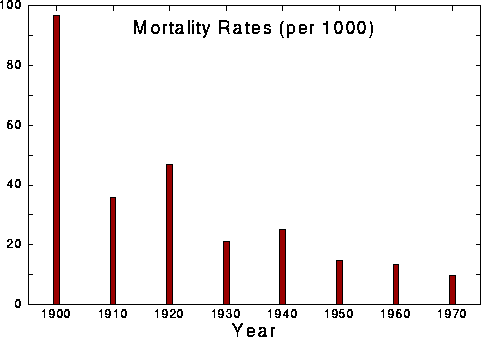
Mortality rates in Bombay have fallen dramatically since independence, although, even before, they were lower than the corresponding rates in villages.

Source: Report of Executive Health Officer, BMC
| Year | 1900 | 1910 | 1920 | 1930 | 1940 | 1950 | 1960 | 1970 |
| Rate | 96.6 | 35.7 | 46.8 | 21.2 | 25.0 | 14.7 | 13.5 | 9.8 |